Histograms
There are four histogram charts - size, baseline duration, Full Width Half Maximum (FWHM) duration, or charge. These charts are plotted against concentration (default, if a concentration value is available for all files selected for viewing), % population (default, where concentration isn't available for all files selected for viewing) or particle count.
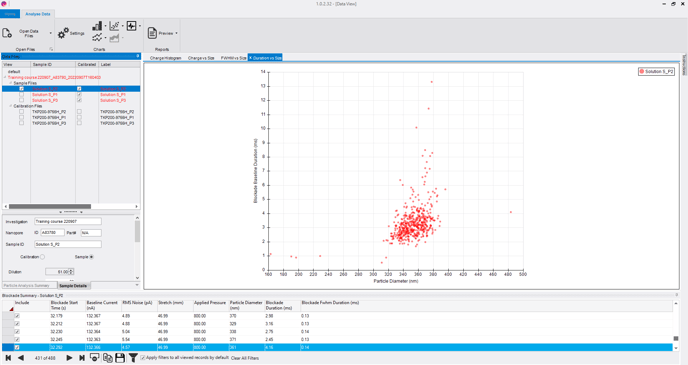
Scatter charts
There are four scatter charts - baseline duration vs size, FWHM duration vs size, FWHM vs baseline duration, and charge vs size.
- The scatter charts shows individual blockades that are detected by the software. Detailed information on each single point is available under BLOCKADE SUMMARY and can be viewed by selecting the data point of interest.
Dynamic charts
There are 3 dynamics charts - particle rate, mean duration (baseline or FWHM) and mean size.
- The particle rate plot can be used to indicate stability of the recording. If particle/samples are stable in the given electrolyte system, a linear plot should be observed.
- The mean size plot can be used to study particle aggregation.
- The mean duration plot can be used to see the difference in particle surface charges. It can also be used to see if a sample has modified the nanopore.
Trace (qNano Control Suite Software only)
- Full trace - view the signal trace for an entire recording.
- Zoom trace - view the trace for a selected data point. Note: Trace charts are only available for a single recording.