The rate plot is used during a recording to evaluate the quality of the data. The rate plot must maintain a linear gradient, as shown below:

crop-png.png?width=385&name=Screenshot%20(146)crop-png.png)
If there is a change to the rate of particles passing through the nanopore then this will be reflected by a change in the gradient of the rate plot. This is demonstrated in the rate plot shown below:
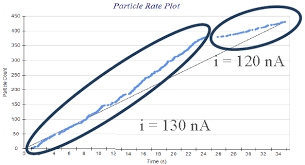
 When this observation occurs, the blockade magnitude and particle rate measurements will be incorrect and will result in inaccurate size and concentration calculations. The system setup must be corrected:
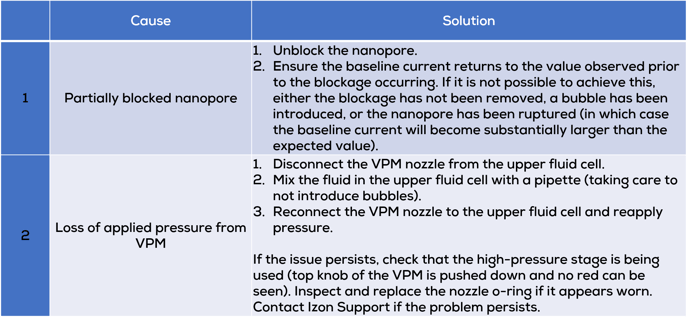
For tips on unblocking a nanopore, read this article for advice.