As many of you are aware, we recently introduced the qEV100 in the 20 nm series – an exciting addition to our qEV column range. During the development of this column, we took the opportunity to put on our ‘continuous improvement’ hats and make a few little tweaks to the qEV100 more generally. This included improving one of the frits and dialling in on which fractions are likely to contain the greatest yield and purity of EVs. During these investigations with human plasma, we discovered that EV purity and yield could be improved by switching to a smaller fraction volume (25 mL, rather than 50 mL) and reducing the purified collection volume (PCV). We also tried a range of sample loading volumes and found that whilst loading 100 mL of sample does give the best yield and purity, volumes down to 25 mL can be used on the column (Figure 1).
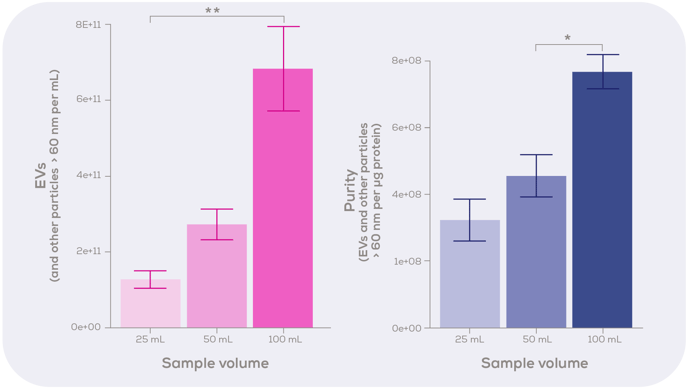
Figure 1: Optimisation of sample loading volume for the qEV100 / 20 nm column. Either 25, 50 or 100 mL of human plasma was run through the qEV100 20 nm series column. EVs and other similarly sized particles were quantified using the Exoid. Protein concentration was analysed using a bicinchoninic acid (BCA) assay. Statistical analysis was performed using the Kruskal-Wallis test with Dunn’s post-hoc test. n = 3-4. Graphs show mean ± standard error.
The next question was whether these changes would also improve the performance of the qEV100 / 35 nm and the qEV100 / 70 nm. The results were consistent with the 20 nm development findings; all qEV100 resin series (the 20, 35 and 70 nm series) showed this improved EV yield and purity with a 25 mL fraction volume (Figure 2).
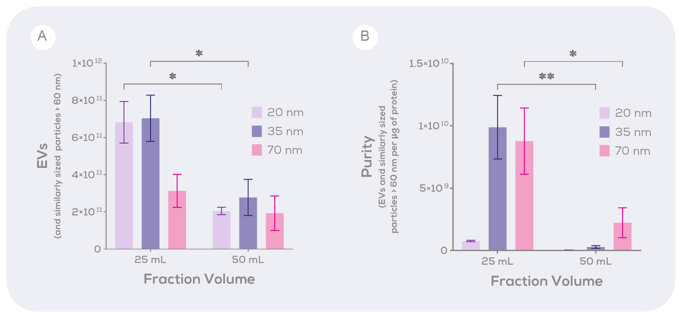
Figure 2: The concentration and purity of extracellular vesicles isolated from human plasma using the qEV100 in the 20 nm, 35 nm Gen 2, and 70 nm Gen 2 series. The (A) concentration of EVs and (B) purity of EVs in the 125 mL or 250 mL purified collection volume of samples isolated from four different volumes of human plasma using the qEV100 in the 20 nm, 35 nm Gen 2, or 70 nm Gen 2 series. EV concentration was determined using the Exoid and protein concentration was determined using a BCA assay. * p<0.05, **p<0.01
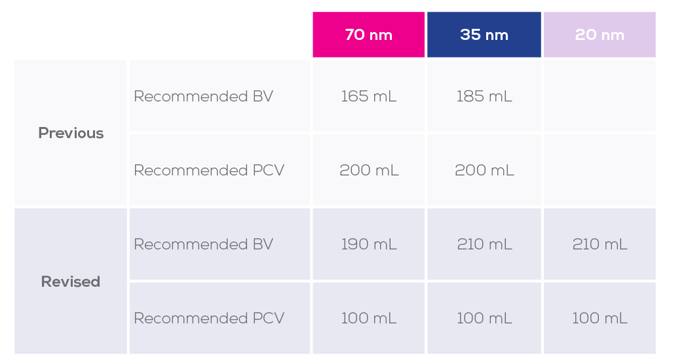
Subsequently, we have revised the qEV100 protocol to apply these optimised recommended buffer volume (BV) and PCV values for the qEV100 in the 20 nm, 35 nm and 70 nm series (Table 1). The user manual has been updated to reflect this change.
Table 1: Previous and revised recommended values for each qEV100 resin series
It is important to note that these values are recommendations only and were determined using human plasma samples, which is the standard sample type used to optimise all of our columns. Finding the PCV containing the best balance between EV yield and purity will depend not only on your sample type, but also your preferences. Therefore, we strongly recommend that you establish an elution profile with your sample, and then optimise your own BV and PCV.
The elution profile employing the revised protocol can be seen in Figure 3.
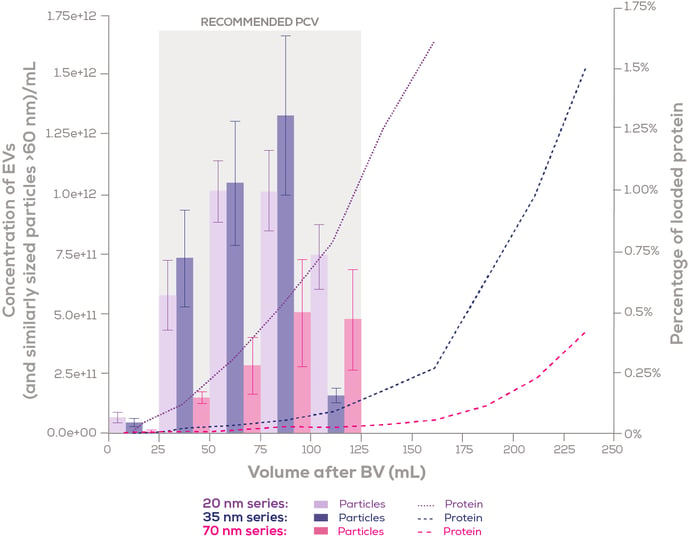
Figure 3: Elution profiles of qEV100 columns (20 nm, 35 nm Gen 2, and 70 nm Gen 2) with 100 mL of human plasma loaded. Particle concentration was measured using the Exoid, and protein concentration was measured using a bicinchoninic acid (BCA) assay. Particle concentration is expressed as the mean ± standard error, while the percentage of protein recovered is depicted using the mean value. n=3 for each column series. BV = Buffer Volume. PCV = Purified Collection Volume.
Please also consider that, by virtue of being bigger, the qEV100 is likely to be more affected by sample-dependent properties, such as EV and protein load, than smaller volume qEV columns. As a result, and as shown in-house, the optimal loading volume for your sample may be less than 100 mL. It is advised to test various sample loading volumes to establish when the relationship between the input volume and the output EV concentration is no longer linear. After this point, the column will be overloaded and there will be a diminishing return of EVs and decreased isolate purity.