- Izon Science Support Centre
- qEV Columns
- qEV Troubleshooting
How much protein is present in the sample post-qEV analysis?
qEVoriginal Legacy columns
Figure 1 shows that the peak fractions 7 to 9 contain very little protein, with it increasing in later fractions.
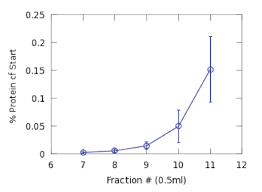 Figure 1: Percentages of protein cf. starting quantity of protein, the error bars are the standard deviation from protein measurements on seven columns.
Figure 2 shows typical purification of EVs relative to protein after qEV purification. The purification factor (reduction in ratio of protein after and before isolation) in each fraction is shown. Fraction 7 and 8 are most enriched, i.e. have most protein removed relative to vesicles recovered.
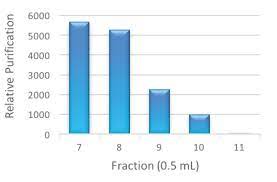 Figure 2: Typical purification of EVs relative to protein after qEV purification.