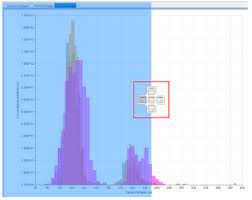
By default, a single chart is displayed with other charts (that have been selected for viewing) appearing as additional tabs at the top of the chart window. This view can be modified to display all charts side-by-side.
To modify the view:
- Hold the left mouse button on a tab containing a chart title.

- Move the mouse to the centre of the chart window and this will display a layout icon. Select the desired layout by clicking on one of the positions (left/right/top/bottom) in the icon.