The Advanced Interface in the ECS software allows manual control of data recording and provides some additional information on your sample. It can be accessed through the Advanced Interface button on the left-hand side of the ECS home screen.
The ECS 1.5 release includes substantial changes to the Advanced Interface. The new Interface is shown in Figure 1 below, with key features labelled.
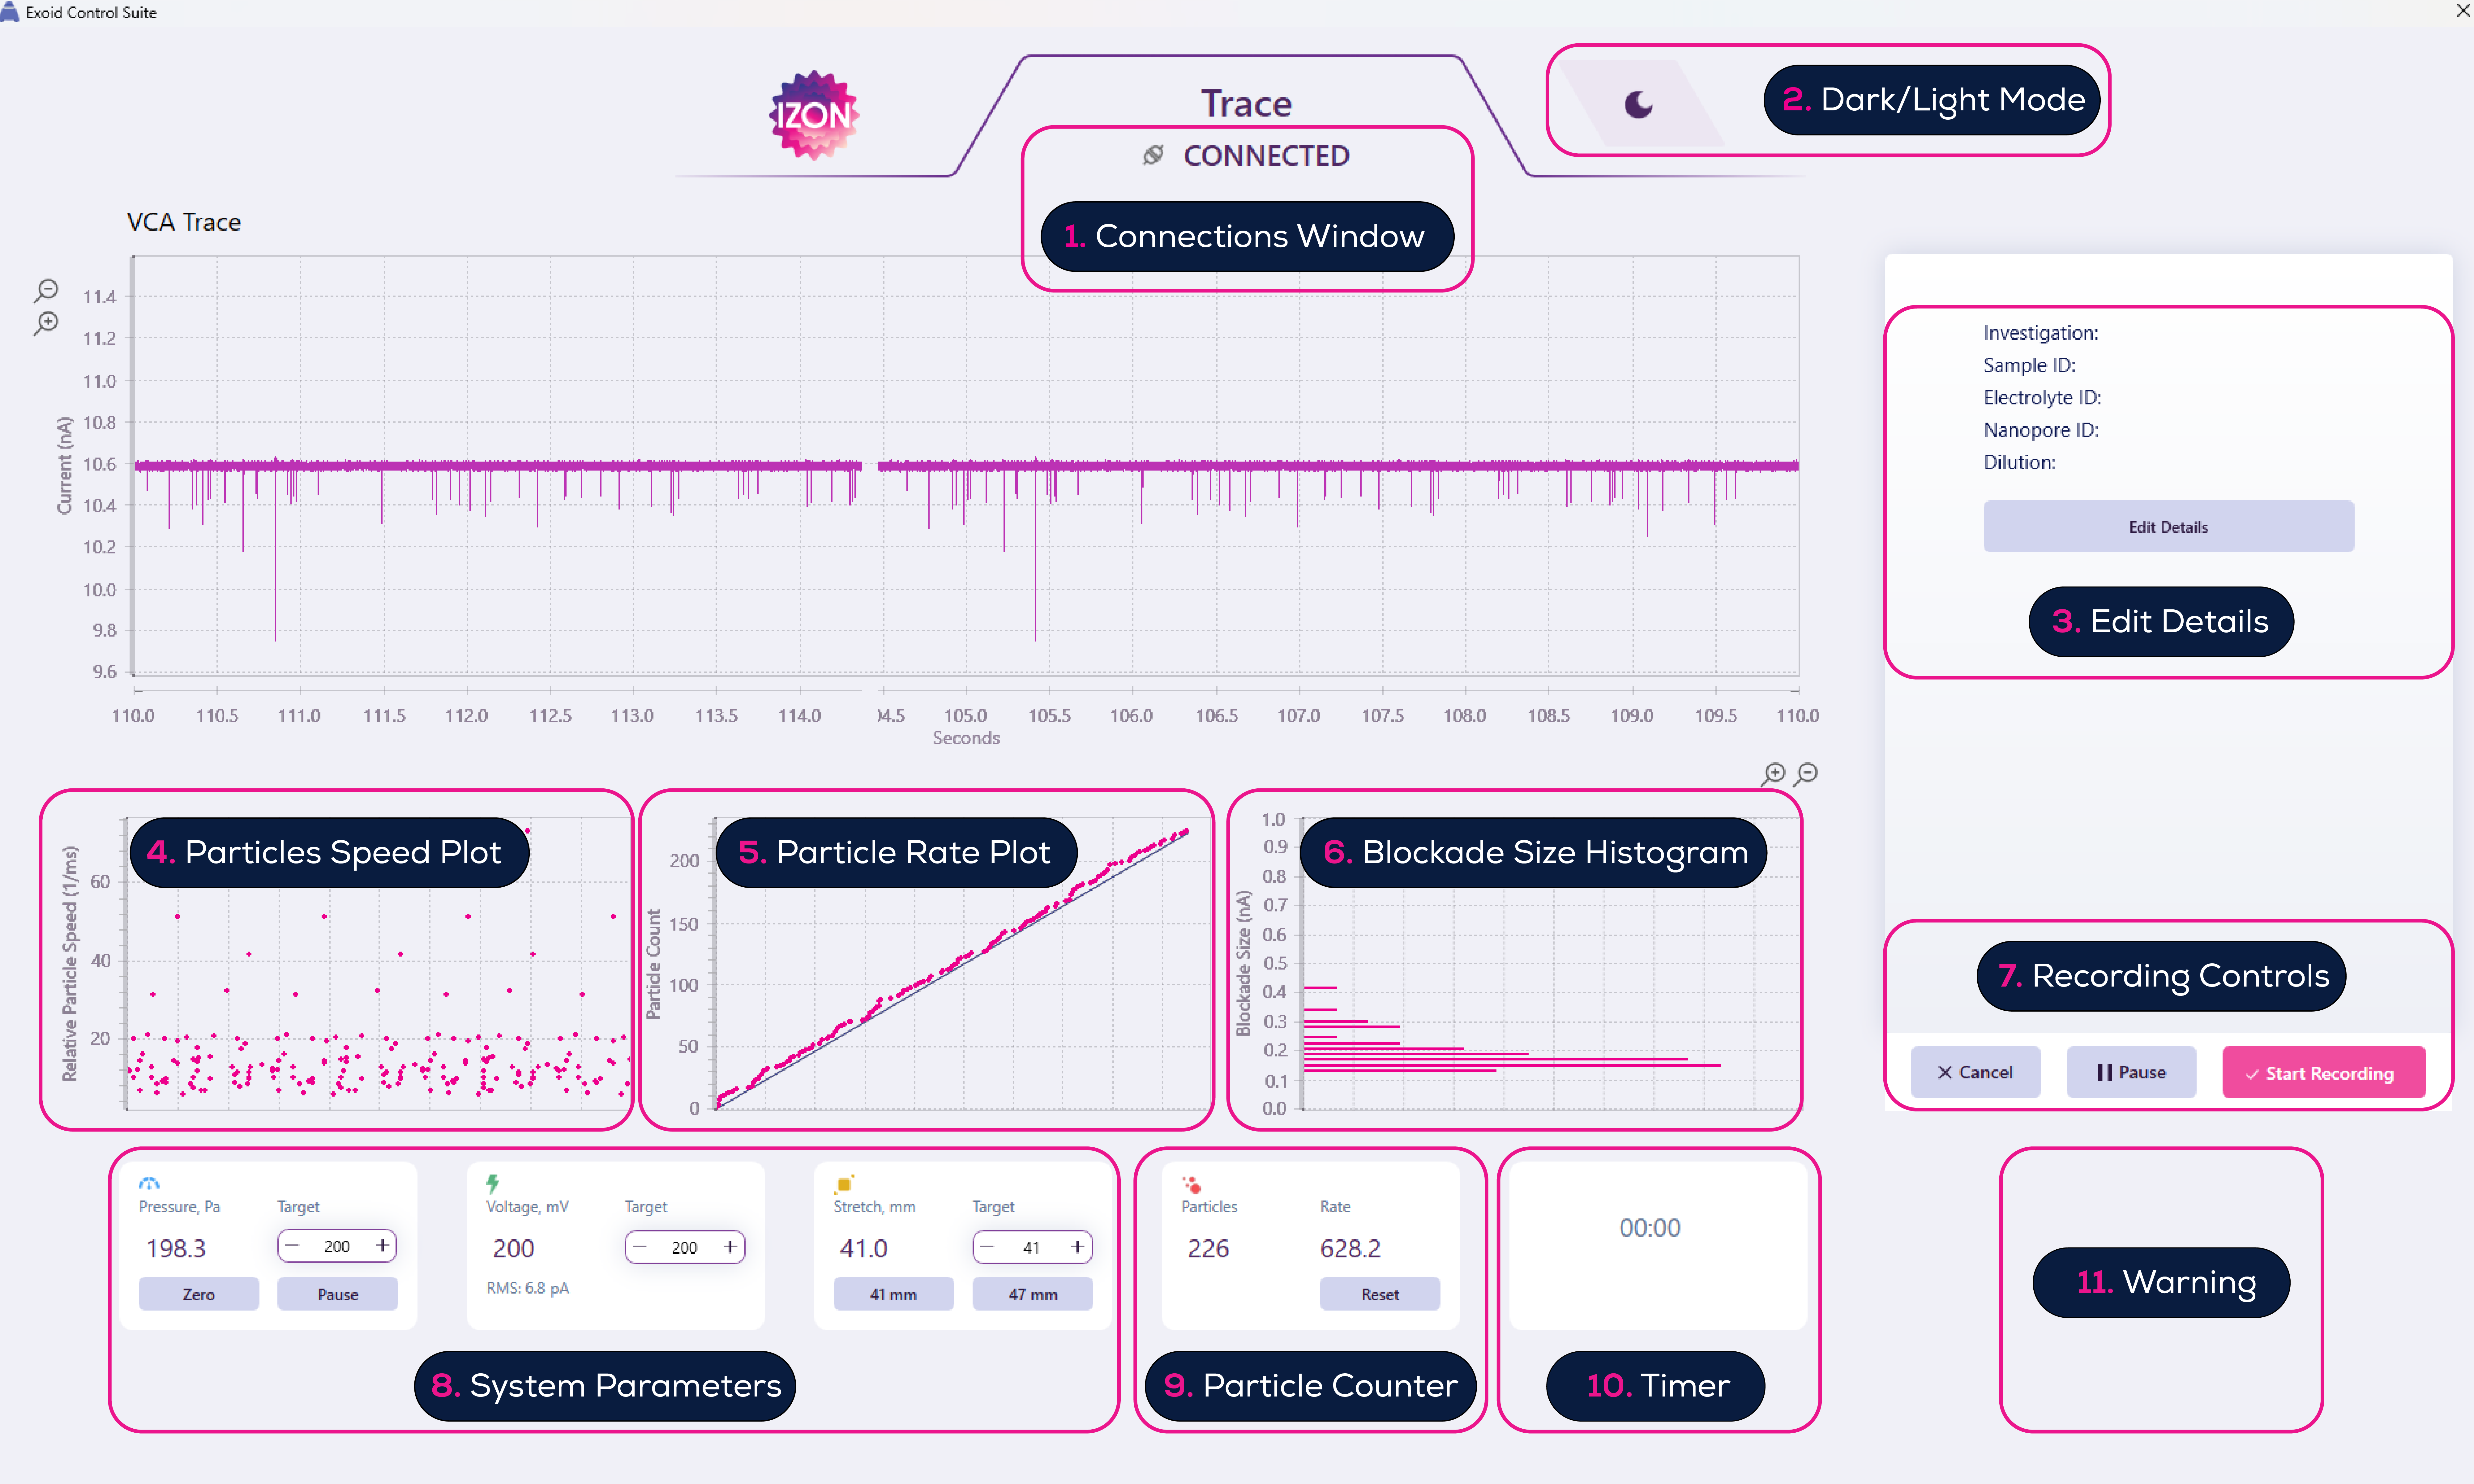
Figure 1: Advanced Interface and features in ECS 1.5.
Advanced Interface features:
1. Connections Window: Access the Connections Window by selecting the connection icon, indicated by (1.) in Figure 1 above. Within the Connections Window, you have access to the APS, Delta, and VCA connections (Figure 2). New to the Advanced Interface with ECS 1.5 is the addition of the APS Recalibration button. Note: this requires the new APS firmware (V2.5.4) to work. Additionally, there is a new toggle to change the VCA current range if required.

Figure 2: Connections window with APS, Delta, and VCA.
2. Dark/Light Mode: Toggle between the sun and moon icon to change between dark and light mode (Figure 3).

Figure 3: Dark (left) and light (right) modes.
3. Edit Details: The ‘Edit Details’ button opens the Investigation Details for editing (Figure 4). This replaces the small square symbol you had to click in ECS V1.4. The panel opens in the right-hand side of the Advanced Interface, as shown in Figure 4. Setting 'Type' to 'Calibration' opens additional fields for calibration particle size and concentration.

Figure 4: Investigation detail fields available for editing.
4. Particle Speed Plot: The Particle Speed plot (Figure 5) shows the relative speed of particles being detected by the software. The relative particle speed is calculated using the FWHM algorithm and is particularly helpful for charge measurements.

Figure 5: Particle Speed Plot showing a step change in particle speed, caused by increasing pressure.
5. Particle Rate Plot: This plot displays the cumulative particle count over time with a straight line overlaid (Figure 6). If the particle rate is constant, the recorded data will be linear. However, if the particles start to deviate from the line, then the rate is fluctuating, and the pore may require troubleshooting. A non-linear plot could indicate that conditions varied during recording time and impacted particle rates. Users may want to discard recordings with non-linear particle rates.

Figure 6: Particle Rate Plots with non-linear particle rate (left) and linear particle rate (right).
6. Blockade Size Histogram: The Blockade Size Histogram shows the frequency distribution of blockade sizes. It is the same as in ECS V1.4 but with minor bug fixes to improve performance. The Blockade Size Histogram can seen as (6.) in Figure 1.
7. Recording Controls: The Recording Controls are functionally the same as in ECS V1.4, with the appearance and location of the buttons having changed. These Controls can seen as (7.) in Figure 1.
8. System Parameters: Pressure, voltage, and stretch can be changed by a) typing in a new value, b) placing the cursor in the relevant box and using the up/down arrows on the keyboard, or c) using the +/- signs flanking the value you want to change (Figure 7). Note: you no longer need to stop the VCA trace to change the voltage.

Figure 7. System Parameter settings.
9. Particle Counter: The Particle Counter shows the cumulative number of particles detected and the current particle rate (Figure 8). You can reset it manually at any time, otherwise it will reset automatically when you click ‘Start Recording’.

Figure 8. Particle Counter reset to 0.
10. Timer: The Timer starts when you select ‘Start Recording’ and will reset (Figure 9) when you click ‘Stop & Save’ or ‘Cancel’. If you pause and resume the recording the Timer will also pause and resume.

Figure 9. Timer reset ready to start a new recording.
11. Warning: A warning will appear in the bottom right corner of the Advanced Interface once you have completed a recording (Figure 10) and will persist until the Sample ID is changed. Note: this does not prevent you from making multiple recordings under the same Sample ID.

Figure 10: Warning that a recording has already been made for this Sample ID.