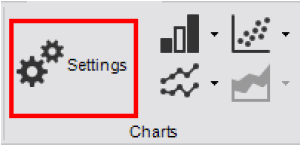
All chart settings are accessed by clicking on the SETTINGS button in the main ribbon. This will open a Chart Settings window to the right of the charts.
A number of categories exist within the CHART SETTINGS window:
- This Data Set - settings within this section are only applied to the data set being viewed. For example, the Sample ID or the colour used to identify the data set in the chart.
- This Chart - settings within this section are only applied to the chart that is currently displayed or highlighted.
- Histogram Settings (Histogram only) - settings within this section are applied to all histograms.
- Global Settings - settings within this section are applied to all charts