qEV columns utilise size exclusion chromatography to isolate extracellular vesicles (EVs). The buffer volume (BV) is first to elute, followed by the EV-containing purified collection volume (PCV) and lastly, protein contaminants.
Default BV and PCV values have been established for each qEV column using human plasma samples and are listed in the respective user manuals. These default values are programmed onto the Automatic Fraction Collector (AFC) and have been selected to prioritise a balance of EV recovery and purity (Figure 1).
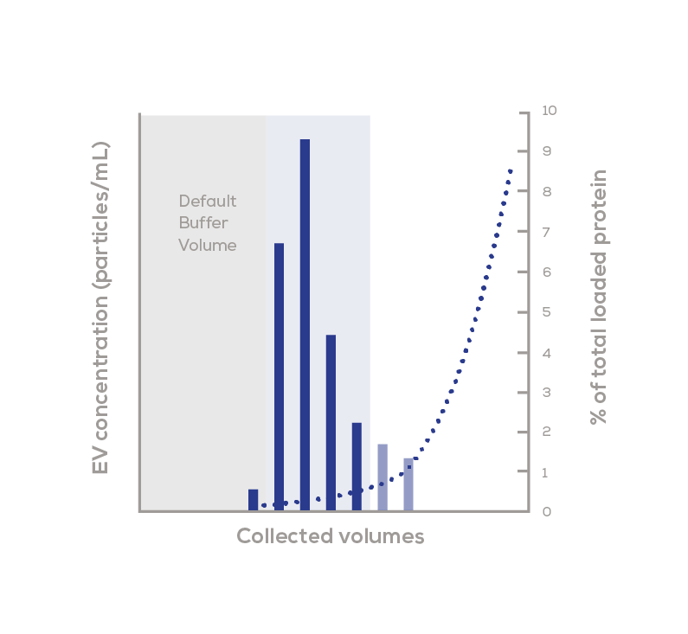
Figure 1: Default elution profile of a human plasma sample separated using a Gen 2 qEV column and Automatic Fraction Collector (AFC). Particle concentration (blue bars) was measured on the Exoid, and protein (blue dotted line) was measured via bicinchoninic acid assay. Faded bars represent estimated particle concentration based on calculations and comparisons from various pooled volumes. Blue shaded area: Purified Collection Volume.
However, the elution profile may differ slightly by sample type, therefore we recommend studying your elution profile to determine which volumes should be collected. Furthermore, depending on the downstream analysis of choice, you may wish to alter the collected volumes in a way that changes EV-protein proportions and subsequently prioritises EV concentration, EV recovery, or EV purity (Figure 2).
.png?width=688&height=1808&name=Figure%20A%2cB%2cC%20(horizontal).png)
Figure 2: Elution profiles, showing adjusted PCVs for prioritisation of A) EV concentration B) EV recovery C) EV purity, of human plasma samples separated using a Gen 2 column and Automatic Fraction Collector (AFC). Particle concentration (blue bars) was measured on the Exoid, and protein (blue dotted line) was measured via bicinchoninic acid assay. Faded bars represent estimated particle concentration based on calculations and comparisons from various pooled volumes. Blue shaded area: Purified Collection Volume.
As illustrated in Figure 2, the high resolution of qEV columns provides the opportunity to customise your collected volumes, based off your priorities and your sample-dependent elution profile. As a result, the volume eluting before the purified collected volumes of interest may change. This is referred to as the ‘Adjusted Buffer Volume’ and is represented by the grey shaded area in Figure 2. To go through this optimisation process, an elution profile will need to be established, as this will differ slightly by sample type*.
*Larger volume columns, like the qEV10, are more affected by sample-dependent properties like EV and protein load, meaning that your optimal loading volume might be less than 10 mL. We suggest testing various loading volumes of your sample to identify when the relationship between the input volume and the output EV concentration is no longer linear. After this point, the column will be overloaded and there will be a diminishing return of EVs and decreased isolate purity.